When to use optical filtering in a machine vision application

Industrial image processing is essentially a requirement in modern manufacturing. Vision solutions can deliver visual quality control, identification and positioning. While vision systems have gotten easier to install and use, there isn’t a one-size-fits-all solution. Knowing how and when you should use optical filtering in a machine vision application is a vital part of making sure your system delivers everything you need.

So when should you use optical filtering in your machine vision applications? ALWAYS. Image filtering increases contrast, usable resolution, image quality and most importantly, it dramatically reduces ambient light interference, which is the number one reason a machine vision application doesn’t work as expected.

Different applications require different types of filtering. I’ve highlighted the most common.

Bandpass Filtering

Different light spectrums will enhance or de-emphasize certain aspects of the target you are inspecting. Therefore, the first thing you want to do is select the proper color/wavelength that will give you the best contrast for your application. For example, if you are using a red area light that transmits at 617nm (Figure 1), you will want to select a filter (Figure 3) to attach to the lens (Figure 2) that passes the frequency of the area light and filters out the rest of the color spectrum. This filter technique is called Bandpass filtering reference (Figure 4).

This allows only the light from the area light to pass through while all other light is filtered out. To further illustrate the kinds of effects that can be emphasized or de-emphasized we can look at the following images of the same product but with different filters.

Another example of Bandpass filtering can be seen in (Figure 9), which demonstrates the benefit of using a filter in an application to read the LOT code and best before sell date. A blue LED light source and a blue Bandpass filter make the information readable, whereas without the filter it isn’t.

f9
Figure 9

Narrow Bandpass Filtering

Narrow bandpass filtering, shown in (Figure 10), is mostly used for laser line dimensional measurement applications, referenced in (Figure 11). This technique creates more ambient light immunity than normal Bandpass filtering. It also decreases the bandwidth of the image and creates a kind of black on white effect which is the desired outcome you want for this application.

Shortpass Filtering

Another optical filtering technique is shortpass filtering, shown in (Figure 12), which is commonly used in color camera imaging because it filters out UV and IR light sources to give you a true color image.
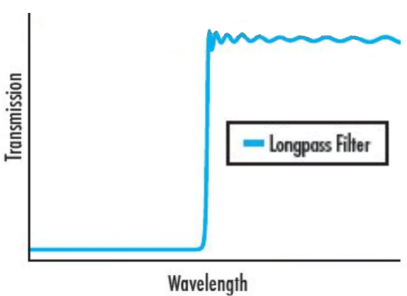
f12
Figure 12

Longpass Filtering

Longpass filtering, referenced in (Figure 13), is often used in IR applications where you want to suppress the visible light spectrum.

f13
Figure 13

Neutral Density Filtering

Neutral density filtering is regularly used in LED inspection. Without filtering, light coming from the LEDs completely saturates the image making it difficult, if not impossible, to do a proper inspection. Deploying neutral density filtering acts like sunglasses for your camera. In short, it reduces the amount of full spectrum light the camera sees.

Polarization Filtering

Polarization filtering is best to use when you have surfaces that are highly reflective or shiny. Polarization filtering can be deployed to reduce glare on your target. You can clearly see the benefits of this in (Figure 14).

f14
Figure 14

Traceability in Manufacturing – More than just RFID and Barcode

Traceability is a term that is commonly used in most plants today. Whether it is being used to describe tracking received and shipped goods, tracking valuable assets down to their exact location, or tracking an item through production as it is being built, traceability is usually associated with only two technologies — RFID and/or barcode. While these two technologies are critical in establishing a framework for traceability within the plant, there are other technologies that can help tell the rest of the story.

Utilizing vision along with a data collection technology adds another dimension to traceability by providing physical evidence in the form of an image. While vision cameras have been widely used in manufacturing for a long time, most cameras operate outside of the traceability system. The vision system and tracking system often operate independently. While they both end up sending data to the same place, that data must be transported and processed separately which causes a major increase in network traffic.

Datamatrixlesen_Platine

Current vision technology allows images to be “stamped” with the information from the barcode or RFID tag. The image becomes redundant traceability by providing visual proof that everything happened correctly in the build process. In addition, instead of sending image files over the network they are sent through a separate channel to a server that contains all the process data from the tag and has the images associated with it. This frees up the production network and provides visual proof that the finished product is what we wanted it to be.

Used separately, the three technologies mentioned above provide actionable data which allows manufacturers to make important decisions.  Used together, they tell a complete story and provide visual evidence of every step along the way. This allows manufacturers to make more informed decisions based on the whole story not just part of it.

How to Select the Best Lighting Techniques for Your Machine Vision Application

The key to deploying a robust machine vision application in a factory automation setting is ensuring that you create the necessary environment for a stable image.  The three areas you must focus on to ensure image stability are: lighting, lensing and material handling.  For this blog, I will focus on the seven main lighting techniques that are used in machine vision applications.

On-Axis Ring Lighting

On-axis ring lighting is the most common type of lighting because in many cases it is integrated on the camera and available as one part number. When using this type of lighting you almost always want to be a few degrees off perpendicular (Image 1A).  If you are perpendicular to the object you will get hot spots in the image (Image 1B), which is not desirable. When the camera with its ring light is tilted slightly off perpendicular you achieve the desired image (Image 1C).

Off-Axes Bright Field Lighting

Off-axes bright field lighting works by having a separate LED source mounted at about 15 degrees off perpendicular and having the camera mounted perpendicular to the surface (Image 2A). This lighting technique works best on mostly flat surfaces. The main surface or field will be bright, and the holes or indentations will be dark (Image 2B).

Dark Field Lighting

Dark field lighting is required to be very close to the part, usually within an inch. The mounting angle of the dark field LEDs needs to be at least 45 degrees or more to create the desired effect (Image 3A).  In short, it has the opposite effect of Bright Field lighting, meaning the surface or field is dark and the indentations or bumps will be much brighter (Image 3B).

Back Lighting

Back lighting works by having the camera pointed directly at the back light in a perpendicular mount.  The object you are inspecting is positioned in between the camera and the back light (Image 4A).  This lighting technique is the most robust that you can use because it creates a black target on a white background (Image 4B).

Diffused Dome Lighting

Diffused dome lighting, aka the salad bowl light, works by having a hole at the top of the salad bowl where the camera is mounted and the LEDs are mounted down at the rim of the salad bowl, pointing straight up which causes the light to reflect off of the curved surface of the salad bowl and it creates very uniform reflection (Image 5A).  Diffused dome lighting is used when the object you are inspecting is curved or non-uniform (Image 5B). After applying this lighting technique to an uneven surface or texture, hotspots and other sharp details are deemphasized, and it creates a sort of matte finish to the image (Image 5C).

Diffused On-Axis Lighting

Diffused on-axis lighting, or DOAL, works by having a LED light source pointed at a beam splitter and the reflected light is then parallel with the direction that the camera is mounted (Image 6A).  DOAL lighting should only be used on flat surfaces where you are trying to diminish very shiny parts of the surface to create a uniformed image.  Applications like DVD, CD, or silicon wafer inspection are some of the most common uses for this type of lighting.

6A
Image 6A


Structured Laser Line Lighting

Structured laser line lighting works by projecting a laser line onto a three-dimensional object (Image 7A), resulting in an image that gives you information on the height of the object.  Depending on the mounting angle of the camera and laser line transmitter, the resulting laser line shift will be larger or smaller as you change the angle of the devices (Image 7B).  When there is no object the laser line will be flat (Image 7C).

Real Life Applications 

The images below, (Image 8A) and (Image 8B) were used for an application that requires the pins of a connector to be counted. As you can see, the bright field lighting on the left does not produce a clear image but the dark field lighting on the right does.

This next example (Image 9A) and (Image 9B) was for an application that requires a bar code to be read through a cellophane wrapper.  The unclear image (Image 9A) was acquired by using an on-axis ring light, while the use of dome lighting (Image 9B) resulted in a clear, easy-to-read image of the bar code.

This example (Image 10A), (Image 10B) and (Image 10C) highlights different lighting techniques on the same object. In the (Image 10A) image, backlighting is being used to measure the smaller hole diameter.  In image (Image 10B) dome lighting is being used for inspecting the taper of the upper hole in reference to the lower hole.  In (Image 10C) dark field lighting is being used to do optical character recognition “OCR” on the object.  Each of these could be viewed as a positive or negative depending on what you are trying to accomplish.

Set your sights on IO-Link for machine vision products

While IO-Link is well addressed in an automated production environment, some have overlooked the benefits IO-Link can deliver for machine vision products.

PLC Gateway-Modus

Any IO-Link device can be connected and controlled by the PLC via fieldbus interface. Saving installation costs and controlling and running IO-Link components are the key values. All the well-known IO-Link benefits apply.

Rainer1

Camera-Modus – without PLC

However, with IO-Link that operates in this mode, the IO-Link-interfaces Rainer2are directly controlled. IO-Link I/O-Modules are automatically detected, configured and controlled.

In a stand-alone situation where an optical inspectionRainer3 of a component is performed without PLC, the operator delivers the component, hits a trigger button, the SmartCamera checks for completeness of production quality, sends a report to a separate customer server, and controls directly via IO-Link interface the connected vision product.

For more information about machine vision and optical identification see www.balluff.com


What’s So Smart About a Smart Camera?

Smart “things” are coming into the consumer market daily. If one Googles “Smart – Anything” they are sure to come up with pages of unique products which promise to make life easier. No doubt, there was a marketing consortium somewhere that chose to use the word “smart” to describe a device which includes many and variable features. The smart camera is a great example of one such product where its name only leads to more confusion due to the relative and ambiguous term used to summarize a large list of features. A smart camera, used in many manufacturing processes and applications, is essentially a more intuitive, all-in-one, plug-and-play, mid-level technology camera.

OK, so maybe the marketing consortium is on to something. “Smart” does indicate a lot of features in a simple, single word, but it is important to determine if those smart features translate into benefits that help solve problems. If a smart camera is really smart it should include the following list of benefits:

  • Intuitive: To say it is easy to use just doesn’t cut it. To say it is easy for a vision engineer to use doesn’t mean that it is easy for an operator, a controls engineer, production engineer, etc. The camera should allow someone who has basic vision knowledge and minimal vision experience to select tools (logically named) and solve general applications without having to consult a manufacturer for a 2 day on-site visit for training and deployment.
  • All-In-One: The camera should house the whole package. This includes the software, manuals, network connections, etc. If the camera requires an external device like a laptop or an external switch to drive it, then it doesn’t qualify as smart.
  • Plug-and-play: Quick set up and deployment is the key. If the camera requires days of training and consultation just to get it up and running, then it’s not smart.
  • Relative technology: Smart cameras don’t necessarily need to have the highest end resolution, memory, or processing speed. These specs simply need to be robust enough to address the application. The best way to determine that is by conducting a feasibility study along with the manufacturer to make sure you are not paying for technology that won’t be needed or used.

Ultimately, a lot of things can be described as “smart”, but if you can make an effort to investigate what smart actually means, it’s a whole lot easier to eliminate the “gotchas” that tend to pop up at the most inopportune times.

Note: As with any vision application, the most important things to consider are lighting, lenses and fixtures. I have heard vision gurus say those three things are more critical than the camera itself.

Inspection, Detection and Documentation – The Trifecta of Work in Process

As the rolling hills of the Bluegrass state turn from frost covered gold of winter to sun splashed green of spring, most Kentuckians are gearing up for “the most exciting two minutes in sports”, otherwise known as The Kentucky Derby. While some fans are interested in the glitz and glamour of the event, the real supporters of the sport, the bettors, are seeking out a big payday. A specific type of wager called a Trifecta, a bet that requires picking the first three finishers in the correct order, traditionally yields thousands, if not tens of thousands, of dollars in reward. This is no easy feat.  It is difficult to pick one horse, let alone three to finish at the top. So while the bettors are seeking out their big payday with a trifecta, the stakeholders in manufacturing organizations around the globe are utilizing the trifecta to ensure their customers are getting quality products. However, the trifecta of work in process is valued in millions of dollars.

WorkinProcess_Header

Work in process, or “WIP”, is an application within manufacturing where the product is tracked from the beginning of the process to the end. The overall goal of tracking the product from start to finish is, among other things, quality assurance. In turn, ensuring the product is of good quality creates loyal customers, prevents product recalls, and satisfies regulations. In a highly competitive manufacturing environment, not being able to ensure quality can be a death sentence for any organization. This is where the trifecta comes back into play. The three processes listed below, when used effectively together, ensure overall product quality and eliminate costly mistakes in manufacturing.

  1. Inspection – Typically executed withWorkinProcess Trifecta a vision system. Just like it sounds, the product is inspected for any irregularities or deviation from “perfect”.
  2. Detection – This is a result of the inspection. If an error is detected action must then be taken to correct it before it is sent to the next station or in some cases the product goes directly to scrap to prevent the investment of any additional resources.
  3. Documentation – Typically executed with RFID technology. The results of the inspection and detection process are written to the RFID tag. Accessing that data at a later time may be necessary to isolate specific component recalls or to prove regulatory compliance.

Whether playing the ponies or manufacturing the next best widget, the trifecta is a necessity in both industries. Utilizing a time tested system of vision and RFID technology has proven effective for quality assurance in manufacturing, but a reliable system for winning the trifecta in the derby is still a work in process.

To learn more about work in process, visit www.balluff.com.

To OCV, or OCR, that is the question

VisionOWLTo OCV, or OCR: that is the question:
Whether ’tis nobler to use OCV (Optical Character Verification) to verify print,
Or OCR (Optical Character Recognition) to decode a sea of print troubles.
And by decoding will turmoil end?
No more to have the camera sleep; we program the TTL (Time to Live)
That font won’t print correctly, ’tis a communication issue?
The undiscover’d font no longer puzzles the will as I can check with OCV.

OCR in Machine Vision software has a library of numbers, letters, fonts, and special characters. Sometimes print is not readable when quality checked using the ISO 1831:1980 specification library. Fortunately, we can teach printed characters utilizing OCV. To verify the quality of print, it can be graded following the ISO 15415,15416 AIM DPM-1-2006/ISO29158 standard. This standard also checks print quality when 1D or 2D barcodes are read.

Hence, methinks even Shakespeare would be impressed by modern-day OCV and OCR technology.

To learn more about machine vision visit www.balluff.us/vision.

Special thanks to Diane Weymier-Dodd for her contribution to this post. 

QR Codes for Business vs Industry

QRCode
Example of a QR code for business use

In a previous post I discussed the different types of bar codes. Aside from the 1D bar codes that we see in the grocery store, the most common type of bar code today is the QR code.

The QR code was 1st designed for the automotive industry to track vehicles in the assembly process. The QR code system became popular outside the automotive industry due to its greater storage capacity compared to standard UPC bar codes. A QR code can have up to 7,089 ASCII characters and can read numeric, alphanumeric, byte/binary, and kanji. Businesses often use this type of QR code on vehicles and products for advertising. When a picture is taken with a cell phone, typically in a QR code reader app, the user will be taken to a website for more information.

Sharpshooter vision sensor for reading micro & QR codes

Micro QR codes, on the other hand, have a limitation of 35 digits of numeric characters. These are usually seen in industrial applications. For example, they are seen on cam shafts, crankshafts, pistons, and circuit boards. An example of data that is often written to a micro QR code would be a serial number to track and trace through an assembly plant. An industrial vision sensor is typically needed to decipher micro QR codes.

ILoveBalluffQRCodes
An example of a QR code (left) vs a micro QR code (right)

For more information visit www.balluff.us.

Isn’t a bar code just a bar code?

Bar codes are normally read via a red line laser scanner, or a camera with decoding and positioning software.

There are 3 main types of bar codes.

1D (one dimensional), 2D (two dimensional) and a different type of 2D code is QR (Quick response) codes that we use today.

Each code has a little different attribute and how it’s read.

 1D bar codes are the ladder line bar codes you typically see in a grocery store, on merchandise and packaging.

While there are many different types of 1D bar codes and how they decipher a code the appearance is typically like the picture below.

1Dbarcode


A 2D Data Matrix code is much smaller than a 1D and can hold quite a bit more information. They can actually hold up to 2,335 alphanumeric characters.

There is redundancy built into the code, in case the code is scratched or defaced.

The code below is an example of a 2D Data Matrix code.

2Dbarcode

The code is read by utilizing a camera and decoding / positioning software.

A QR Code can hold more information than a Data Matrix code.

It can decipher numeric, alphanumeric, byte/binary and kanji.

While it was 1st developed for the automotive industry tracking parts during vehicle manufacturing, it is typically linked to a website when the code is scanned with a camera in a cell phone.

An example of the QR Code is pictured below.

QR Code

The code is read by utilizing a camera and decoding / positioning software.

There are various types of vision sensors that can be used to read different types of bar codes. You can learn more on Balluff’s website at www.balluff.us/vision.

What’s best for integrating Poka-yoke or Mistake Proofing sensors?

Teams considering poka-yoke or mistake proofing applications typically contact us with a problem in hand.  “Can you help us detect this problem?”

We spend a lot of time:

  • talking about the product and the mistakes being made
  • identifying the error and how to contain it
  • and attempting to select the best sensing technology to solve the application.

However this can sometimes be the easy part of the project.  Many times a great sensor solution is identified but the proper controls inputs are not available or the control architecture doesn’t support analog inputs or network connections.  The amount of time and dollar investments to integrate the sensor solution dramatically increases and sometimes the best poka-yoke solutions go un-implemented!”

“Sometimes the best poka-yoke solutions go un-implemented!”

Many of our customers are finding that the best controls architecture for their continuous improvement processes involves the use of IO-Link integrated with their existing architectures.  It can be very quickly integrated into the existing controls and has a wide variety of technologies available.  Both of these factors make it the best for integrating Poka-yoke or Mistake Proofing due to the great flexibility and easy integration.

Download this whitepaper and read about how a continuous improvement technician installed and integrated an error-proofing sensor in 20 minutes!