
The P-F curve is often mentioned in condition monitoring and predictive maintenance discussions. “P-F” refers to the interval between the detection of a potential failure (P) and the occurrence of a functional failure (F).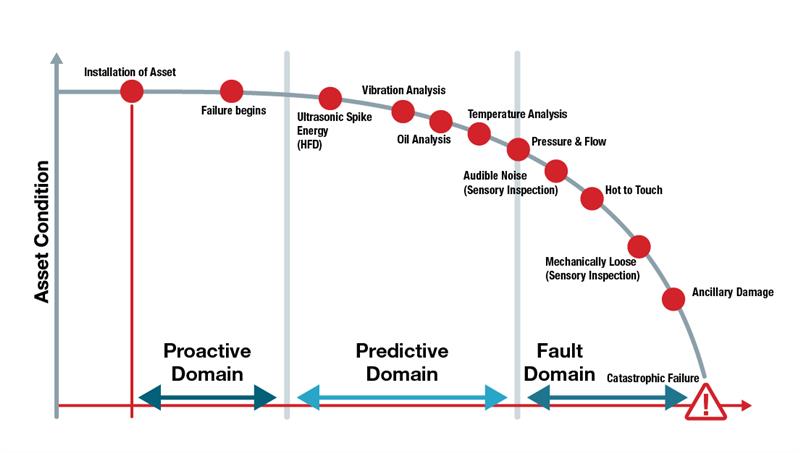 The P-F curve is an illustrative generalization of what happens to an asset, machine or component as it ages, degrades, and eventually fails. It shows the different stages of an asset’s life, how machine failures progress, and how and when different symptoms emerge which might signal impending (or actual) failure.
The time scale in Fig. 1 is obviously exaggerated, and most assets operate for a lengthy period of time before failure starts to occur. The steepness of the failure portion of the curve can vary from asset to asset, but it generally follows the same pattern as shown in the diagram.
At first, performance degradation is minor and may not require significant action. As time progresses, the potential failure indicators become stronger and more easily detectable and the performance degradation becomes more severe, eventually ending in catastrophic failure.
The timeline is split into three domains:
-
-
- Proactive domain – the failure is relatively far off (machine may still be new). Proactive activities include designing for reliability, precision installation & alignment and life cycle asset management. These can significantly extend the time until potential and functional failures occur.
- Predictive domain – the failure may still be far off, but symptoms are emerging and offer (relatively) early warning signs. Timely action may be taken to prevent failure or replace failing equipment before catastrophic failure occurs.
- Fault domain – the failure is occurring or inevitable, and symptoms indicate immediate action is needed to address the failure.
-
During these domains, different indicators/symptoms emerge. Ultrasonic, vibration and oil analysis often signal problems early; then temperature rise and noise emerge a bit later; and finally, parts come loose and more severe damage occurs. Depending on the asset, other indicators may be shown by activities including corrosion monitoring, motor current/power analysis and process parameter trending (e.g., flows, rates, pressures, temperatures, etc.).
By analyzing which symptoms of failure are likely to appear in the predictive domain for a given piece of equipment, you can determine which failure indicators to prioritize in your own condition monitoring and predictive maintenance discussions.
Click here to read more about condition monitoring.
Share this:

Tom Knauer
Tom Knauer has more than 25 years of experience in the industrial automation industry, with equipment/solution suppliers including GE Fanuc, Parker Hannifin, Omron STI and Balluff. His roles have included product management, sales, marketing, finance and business strategy; his product experience covers PLCs, CNCs, motion control and safety. Tom's current focus is on developing and growing the Balluff manufacturing & plant engineering and safety businesses in the Americas, working closely with customers, sales, product management and product development. His recent activities include work on current and future safety sensing to support collaborative robots and mobile robots, and device level safety networks combining standard and safety sensors.
3 Replies to “Identify Failures Before They Happen: The PF Curve”